Close Menu
    X (Twitter)
    Blockchain Journal
    • News
      • Blockchain News
      • Bitcoin News
      • Ethereum News
      • NFT
      • DeFi News
      • Polkadot News
      • Chainlink News
      • Ripple News
      • Cardano News
      • EOS News
      • Litecoin News
      • Monero News
      • Stellar News
      • Tron News
      • Press Releases
      • Opinion
      • Sponsored
    • Price Analisys
    • Learn Crypto
    • Contact
    • bandera
    Facebook X (Twitter) Instagram
    Blockchain Journal
    Home » Technical analysis of the Bitcoin rate indicates an early growth, says analyst CoinDesk

    Technical analysis of the Bitcoin rate indicates an early growth, says analyst CoinDesk

    0
    By BlockchainJournal on February 5, 2019 News, Price Analisys
    Share
    Facebook Twitter LinkedIn Pinterest Email

    CoinDesk analyst Omkar Godboul is sure that soon “ digital gold ” can overcome the $ 3,658 milestone. This will pave the way for Bitcoin's price to the psychological $ 4,000 mark.

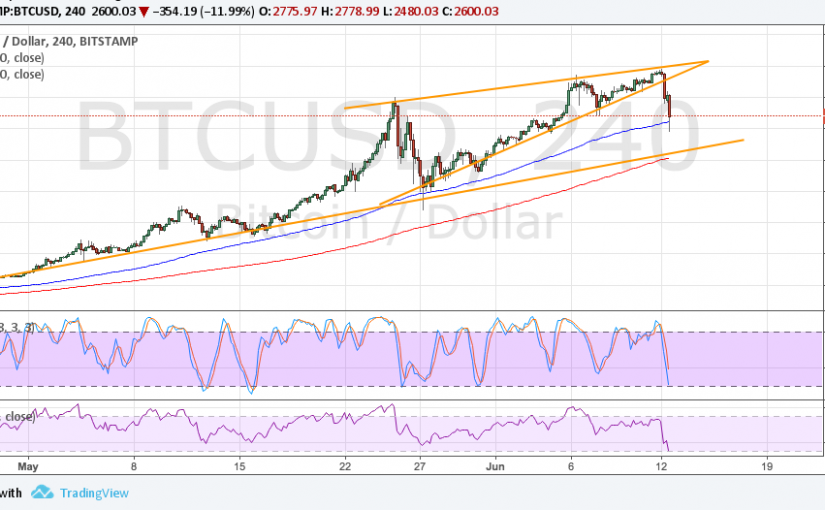
    According to his words , is gradually waning dominance of bears on the daily chart has formed a pattern of ascending correction "falling wedge". This figure has been forming for quite a long time – over the past six weeks, which indicates its relative reliability.

    Currently, the first cryptocurrency is trading at around $ 3,400, which is about 20% below the December 24 high (near the $ 4,200 mark).

    Daily and four-hour graphics

    On the daily timeframe, you can see that the price of BTC is trapped within the bounds of the falling wedge pattern. In addition, on the lower timeframe it can be seen that the price inside the wedge moves in an upward channel.

    The probability of breakdown of the upper boundary of the wedge at around $ 3450 will decrease if the price breaks through the lower boundary of the channel. Then the price is likely to go to the bottom of the figure at around $ 3,314

    If, however, a breakdown of the upper boundary of the wedge occurs, the way will be opened to the level of $ 3,658, corresponding to the maximum of the “gravestone doji” candle formed on January 26th.

    Weekly schedule

    On a higher timeframe, moving averages with periods of 5 and 10 are directed "to the south", signaling a bear market. However, the volumes are falling, which indicates a decrease in sales pressure and a possible forthcoming triggering of the “Falling Wedge” pattern.

    Earlier, Omkar Godboul came to the conclusion that February is usually a good month for Bitcoin.

    Interactive Bitcoin schedule for the current moment:

    Publication date 05/02/2019
    Share this material on social networks and leave your opinion in the comments below.


    Bitcoin BTC Featured
    Share. Facebook Twitter Pinterest LinkedIn Tumblr Email
    BlockchainJournal

    Related Posts

    ARK Invest Unloads Coinbase and GBTC Shares by Millions Amid Market Boom

    December 6, 20232 Mins Read

    GBTC Discount Shrinks as Bitcoin Price Surges

    December 6, 20232 Mins Read

    IBM Introduces OSO, Designed for Cold Storage of Digital Assets

    December 6, 20232 Mins Read

    Marathon Digital Produced 1,187 Bitcoins in November and Held 14,025 Unrestricted BTC

    December 5, 20232 Mins Read

    Volume Counterfeiting Allegations Rock RATS Token on Gate Exchange

    December 5, 20232 Mins Read

    A New Era for Cryptocurrency: Zodia Custody’s Integration with Harmonize

    December 4, 20232 Mins Read

    Subscribe to Updates

    Get the latest creative news from FooBar about art, design and business.

    © 2025 Blockchain Journal

    Type above and press Enter to search. Press Esc to cancel.

    We use cookies to ensure that we give you the best experience on our website. If you continue to use this site we will assume that you are happy with it.