Today, June 26, the price of the first cryptocurrency updated the next maximum, breaking the $ 13,000 mark.

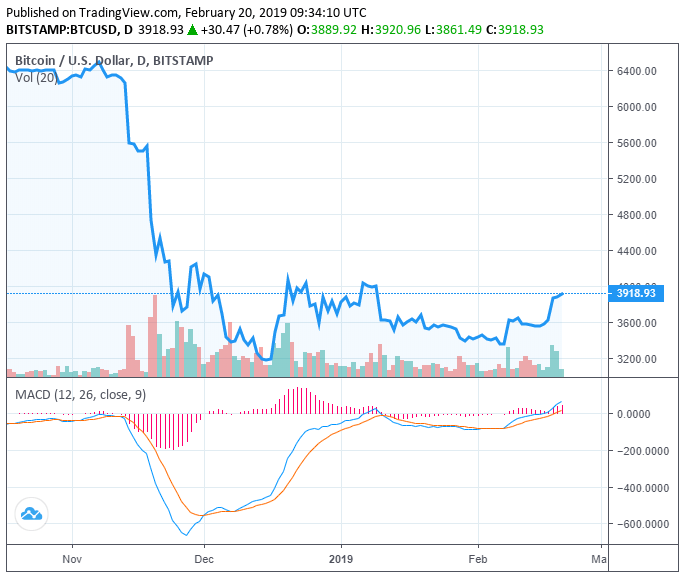
Half-hour BTC / USD chart of Bitstamp from TradingView
APDATE: closer to midnight (MSK / Kiev) there was an impressive correction – in a short time the price fell by more than $ 1,500, returning to marks just above $ 12,000:

Half-hour BTC / USD chart of Bitstamp from TradingView
Against the background of the fall in the BTC rate on the BitMEX exchange, a large wave of liquidations occurred (almost $ 250 million):
Update: BTC $ – Massive liquidations are going through BitMex. Almost 250mio $ pic.twitter.com/9PMDm93hXT
– Patrick Heusser (@heussepa) 26 worm 2019 r.
Also, traders complain about strong slippage of orders:
Lol slippage on Bitmex $ btc pic.twitter.com/e0sGRnrXtr
– Coiner-Yadox (@Yodaskk) 26 worm 2019 r.
It is also worth noting that, against the background of a rapid rise in the price of Bitcoin, the Mayer Multiple indicator rose above the 2.4 mark. The last time this indicator showed such high values at the turn of 2017-2018, when there were clear signs of a speculative bubble in the market.
For example, in December 2017, the indicator reached a value of 2.4, when bitcoin was trading around $ 11,000. According to CoinDesk analyst Omkar Godboul, only 16 days later, the price of BTC rose to $ 20,000.
Recall that some technical analysts admit a high probability of price correction to the level of $ 10,000 .
Subscribe to the BlockchainJournal news in Telegram: BlockchainJournal Live – the entire news feed, BlockchainJournal – the most important news and polls.
BlockchainJournal.news
BlockchainJournal.news

